Investment Office
Assets and Performance

Endowment Market Value
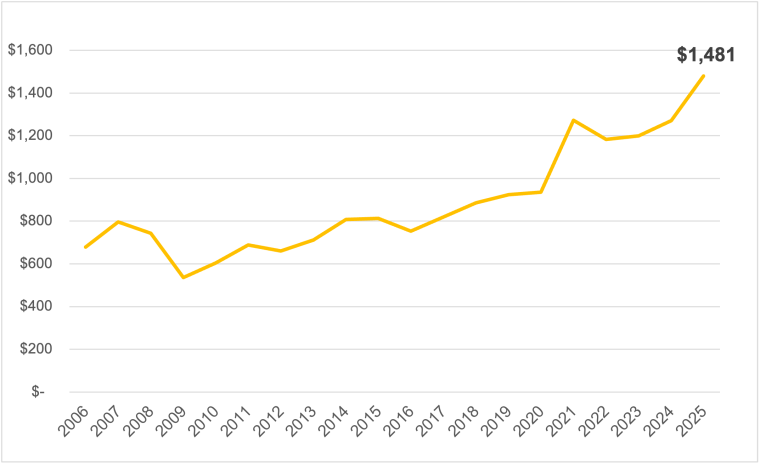
Total endowed funds as of June 30, 2025, were $1,480.8 million, as compared to $1,270.5 million the previous year—an increase of $210.3 million. The change in total value from year to year results from changes in the market value of investments, gifts received from donors, and the endowment spending payout. The payout from the endowment supports Oberlin’s operating budget and provides long-term funding for student financial aid, faculty compensation, and academic programs.
Endowment Market Value (20 Year Trend)
Investment Performance
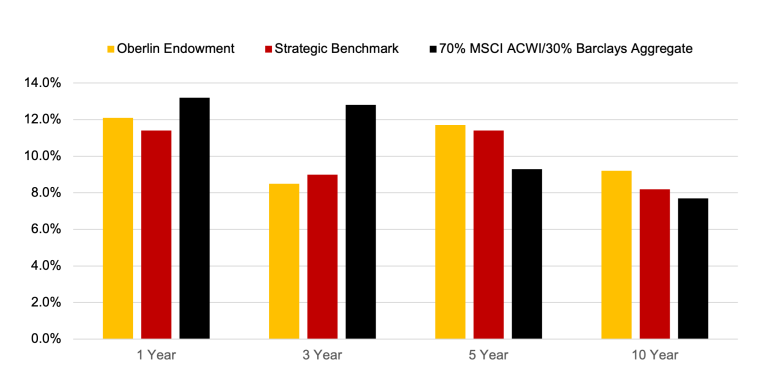
In fiscal year 2025, Oberlin’s net total investment return for the endowment was 12.1 percent as compared to a total net return in fiscal year 2024 of 8.5 percent, resulting in continued top quartile rankings across the institution’s peer group in the one, five, and ten-year measurement periods.
Endowment and Benchmark Returns
Accessible data table
| 1 year | 3 year | 5 year | 10 year | |
|---|---|---|---|---|
| Oberlin endowment | 8.5% | 2.7% | 10.2% | 8.3% |
| Strategic benchmark | 10.0% | 3.3% | 9.3% | 7.3% |
| 70% MSCI ACWI/30% Barclays Aggregate | 14.2% | 3.0% | 7.6% | 6.5% |
Peer Comparison
Average Annual Compound Returns ($1-5 Billion Endowments)
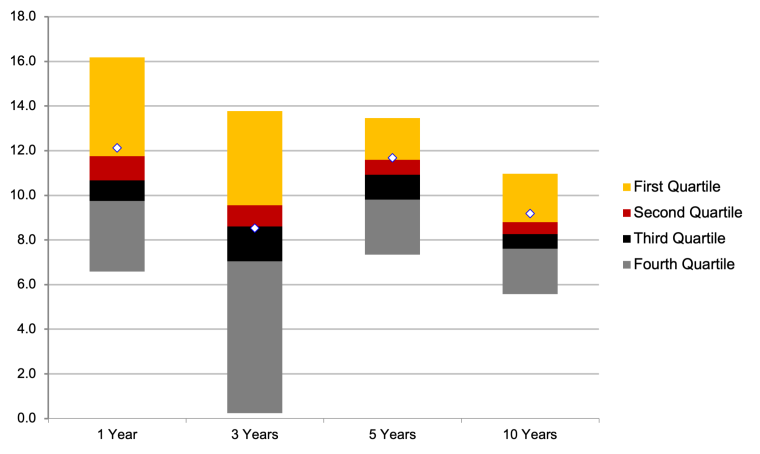
Accessible description ($1-5 billion endowments)
The Y axis shows return percent, and the X axis shows 4 categories: 1 year, 3 years, 5 years, and 10 years. For each category, a shaded column indicates the range of returns for all institutions, divided into quartiles. Oberlin’s return is plotted as a point in the column. The height of each column shrinks as the time period gets longer, indicating reduced variance for longer time periods.
- In the 1-year category, returns range from a low of about 4% to a high of about 16%, with the median at about 10%. Oberlin's return of 8.5% is at the top of the fourth quartile.
- In the 3-year category, returns range from -2% to about 7%, with the median at about 3%. Oberlin's return of 2.7% is in the third quartile.
- In the 5-year category, returns range from 5% to about 8%, with the median at about 9%. Oberlin's return of 10.2% is in the top quartile.
- In the 10-year category, returns range from about 5% to about 11%, with the median at about 7%. Oberlin's return of 8.3% is in the top quartile.
Asset Allocation
Oberlin’s endowment has a highly diversified portfolio with allocations to fixed income/cash, public equity, and alternative strategies that include absolute return, private equity venture capital, and real assets. The following is the college’s long-term strategic target and actual endowment portfolio allocation for the year ending June 30, 2025.
| Asset Allocation | Strategic Target % | Actual % |
|---|---|---|
| Cash and cash equivalents | 4 | 9 |
| Fixed income | 3 | 3 |
| Developed markets equity | 27 | 30 |
| Emerging markets equity | 9 | 9 |
| Absolute return | 20 | 16 |
| Private equity | 15 | 10 |
| Venture capital | 17 | 21 |
| Real assets | 5 | 3 |
| Total | 100% | 100% |
All data provided on this page is updated with audited financial statements and publicly released surveys on an annual basis as of June 30.