
| Oscillations and Waves
> Oscillations > Nonlinear
Systems |
DCS# 3A95.50b |
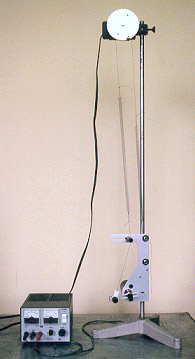
| Pasco nonlinear oscillator | 202-13-F |
| DC power supply | 202-08-D |
| laptop
with
LoggerPro |
206 |
| LabPro interface | 107-02-B3 |
| photogate | 202-14-C2 |
| 1/4"
stereo jack to BTA adapter |
202-14-C1 |
| Set up nonlinear
oscillator
in the usual manner. Position photogate so
driver passes
through it once each cycle. Adjust frequency for chaotic motion. Use LoggerPro 3 "poincare" experiment file. ch1 = raw
voltage: to read photogate voltage
Check measured photogate voltage and, if necessary, modify values in constant phase definitions. The points at the origin are artifacts resulting from the method used for obtaining a poincare plot from the rotary motion sensor data. |
 |

